Ultrasonic Sensor + OLED Parking Sensor Lab
Parking Sensor Lab
TAC 348 - Making Smart Devices
Lab Learning Objectives
By the end of this lab, you will be able to:
- Combine distance measurements and OLED graphics in one device
- Use a rolling average to reduce noise in sensor data
- Use distance thresholds to select text and bitmap graphics
- Use
map()and clamping to convert distance into a bar width
Before You Begin
- You should be able to read distance with the ultrasonic sensor
- You should understand how a bitmap is stored and drawn on the OLED
- The starting project includes the basic sensor and OLED setup
Overview
- Build a parking sensor display using the ultrasonic sensor and OLED
- The sensor distance controls what is drawn on screen in real time
- Features
- Signal smoothing: average the last several readings to reduce noise
- Zone bitmaps: display a different graphic depending on how close the object is
- Continuous mapping: a sensor value drives a bar graphic directly
What We’re Building
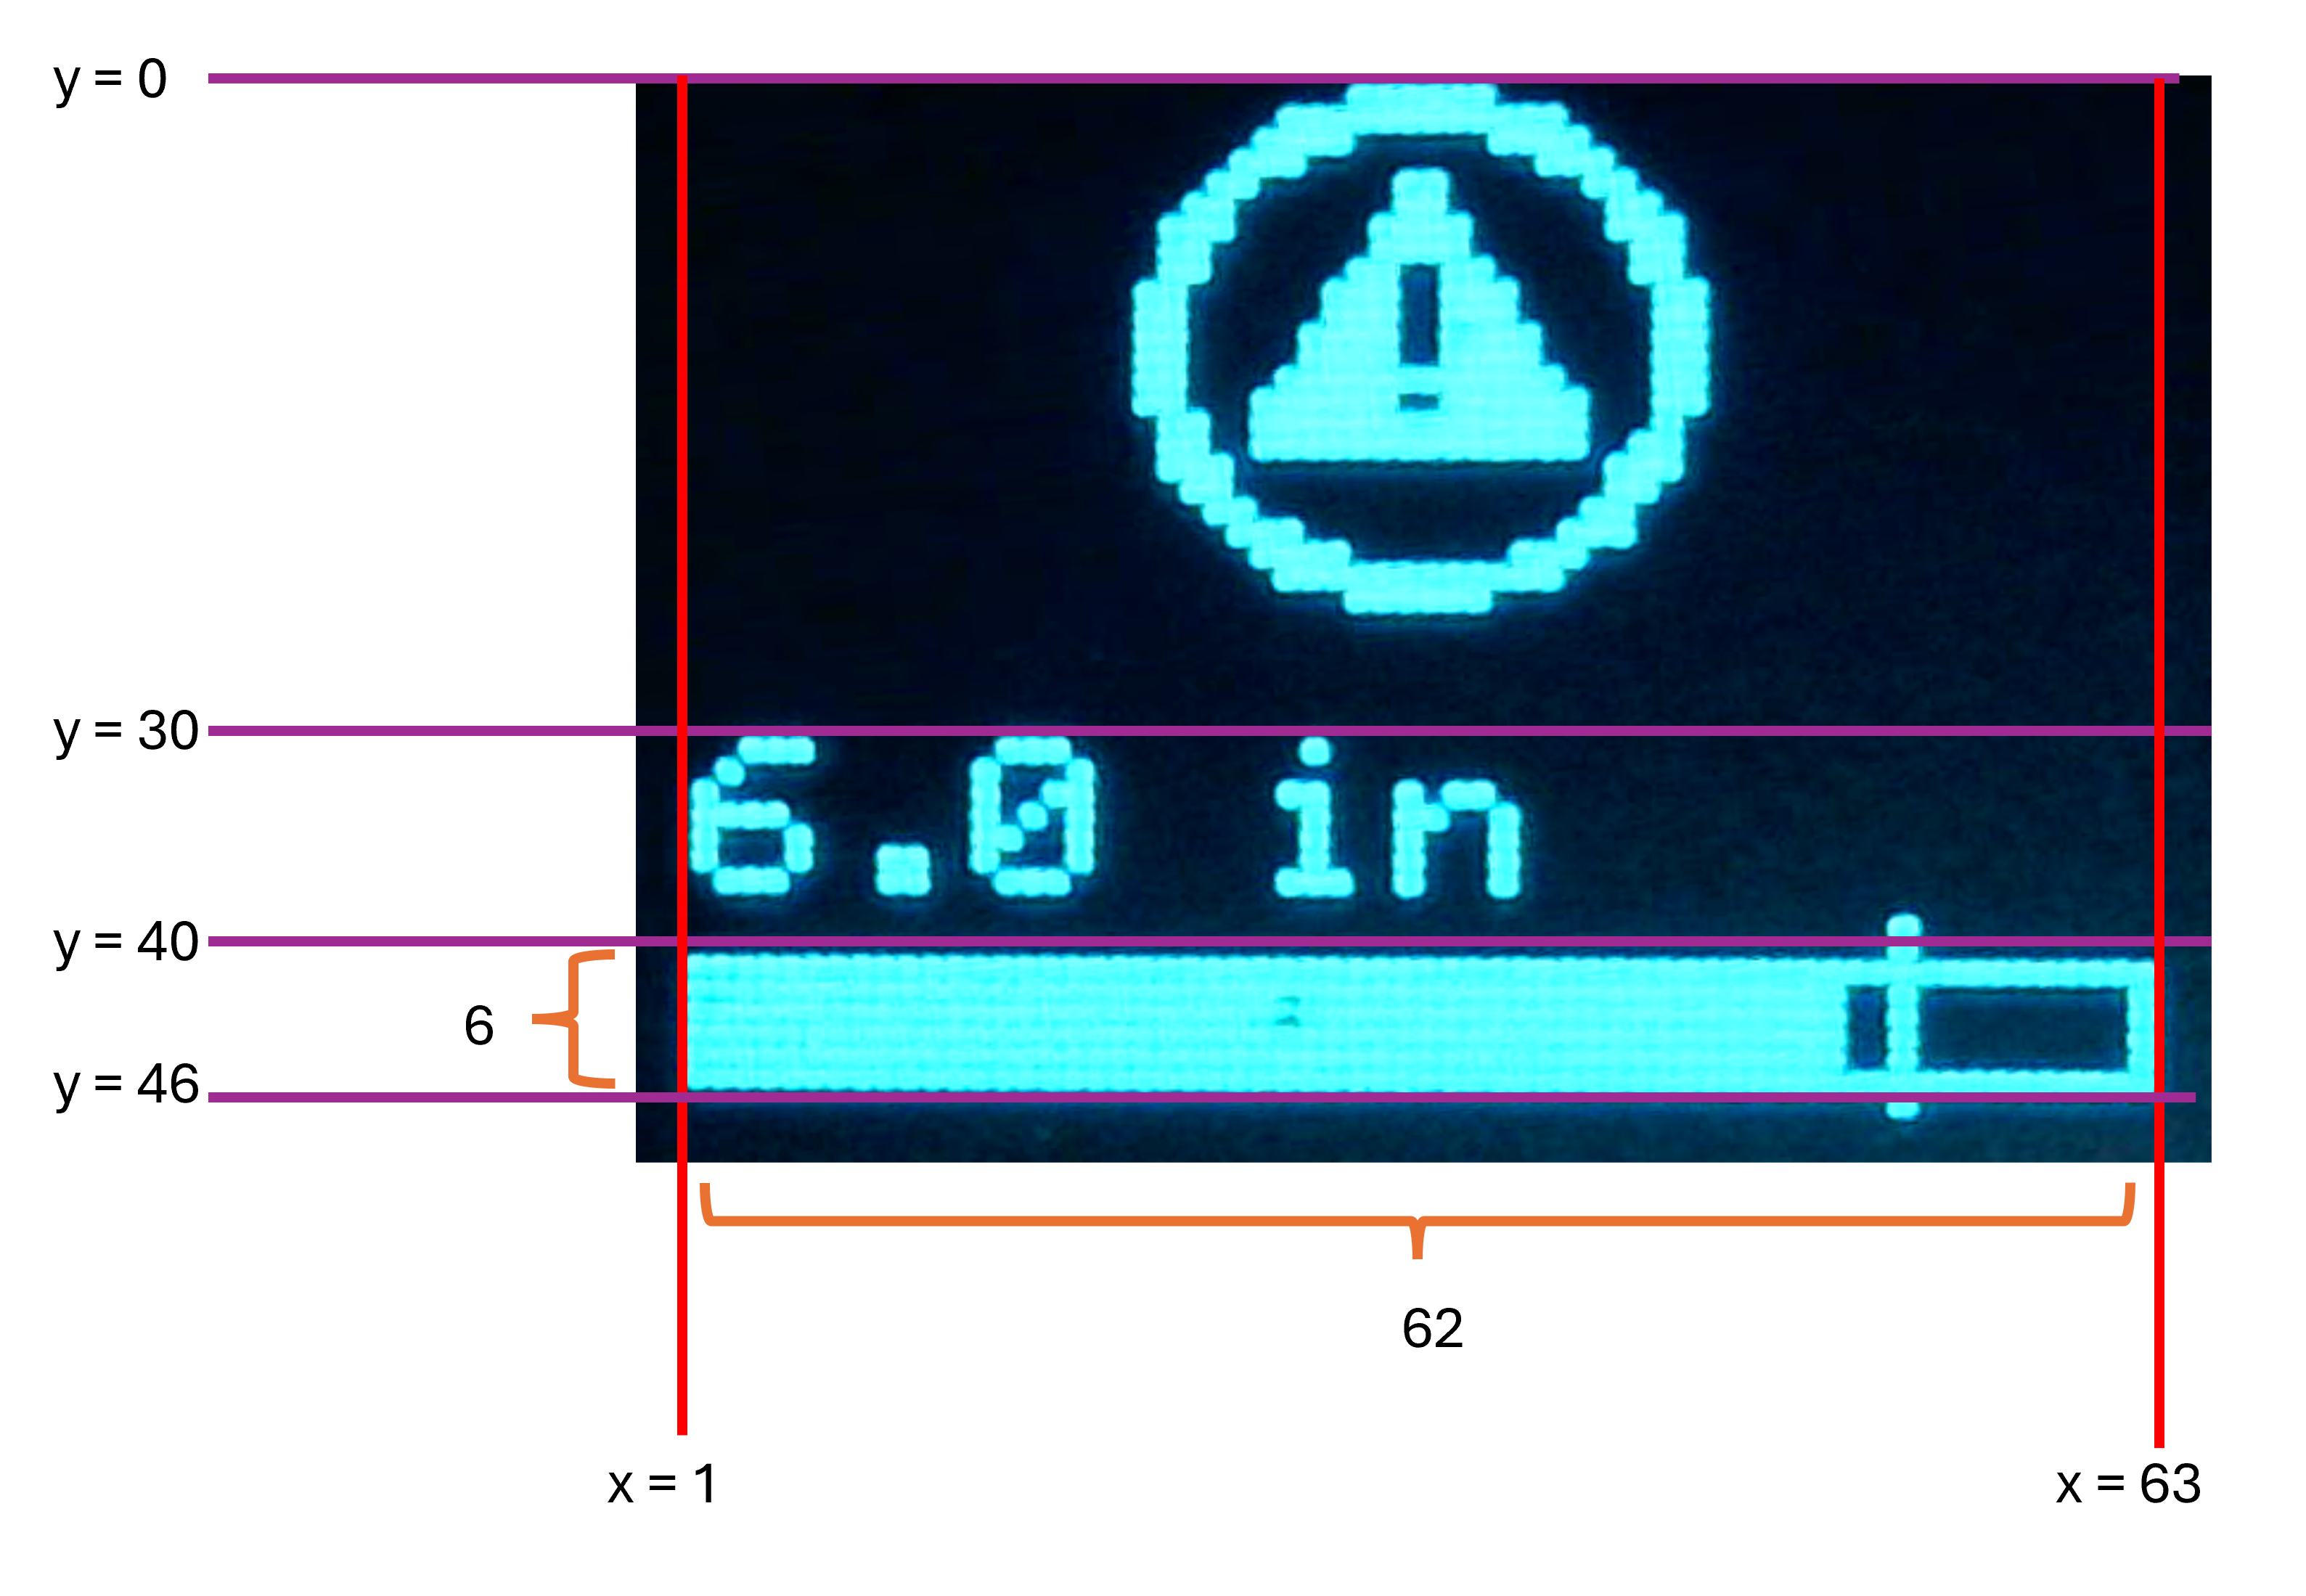
- The OLED shows three things at once
- A bitmap that changes based on zone (FAR / NEAR / STOP!)
- The distance in inches
- A bar graph that fills as your hand gets closer
- Three zones based on distance
- FAR: more than 24 inches (green check graphic)
- NEAR: between 4 and 24 inches (warning graphic)
- STOP!: closer than 4 inches (red X graphic)
OLED Layout
Sensor Noise
- Ultrasonic sensors occasionally return bad readings
- The pulse can reflect off a wall or surface behind your hand and come back late
- Example: Your hand is 10 inches away, but the sensor reads 145 inches
- Two kinds of bad readings
sensorTime == 0: no echo came back- Distance is unreasonably large: a reflection came from another surface
Rolling Average
- Instead of using a single reading each loop, store the last 5 readings in an array and average them
- If one reading is bad, it has only 1 / 5 of the effect on the displayed value
- This is a rolling average (or sliding window average)
- The window slides forward with each new reading
- Old readings fall off the back; new readings come in the front
How the Array Works
- Store readings in a fixed-size array; track where the next one goes with
readIndex
readings[readIndex] = distanceIn;
readIndex = readIndex + 1;
if (readIndex >= NUM_READINGS) {
    readIndex = 0;  // Wrap back to the start
}
How the Array Works
- After storing the new reading, compute the average
float total = 0;
for (int i = 0; i < NUM_READINGS; i++) {
    total = total + readings[i];
}
return total / NUM_READINGS;
Handling Bad Readings
- If the reading is zero or outside the reliable range, skip the array update and keep the last good readings
Handling Bad Readings: Corrected
if (distanceIn != 0 && distanceIn < MAX_RANGE_IN) {
    readings[readIndex] = distanceIn;
    readIndex = readIndex + 1;
    if (readIndex >= NUM_READINGS) {
        readIndex = 0;
    }
}
Bitmaps
drawBitmap()always draws from the top-left corner- Use a half-screen bitmap so there is room for the distance and bar graph
- Choose the bitmap after comparing the distance to the FAR and STOP thresholds
The map() Function
map()converts a value from one range to another
map(value, fromLow, fromHigh, toLow, toHigh)
- Example: Convert a distance (0 to 24 in) to a bar width (0 to 60 px)
int barFill = map(inches, 0, 24, 60, 0);
// inches = 0:  barFill = 60 (full bar; hand is close)
// inches = 24: barFill = 0  (empty bar; hand is far away)
- Notice
toLowandtoHighare reversed: as distance increases, the bar shrinks
Clamping Before map()
map()does not clamp; if the input is out of range, the output will be too
// Without clamping, a reading of 30 in gives a negative barFill
int barFill = map(30, 0, 24, 60, 0);  // Result: -15
- Always clamp the input first
if (displayIn > FAR_THRESHOLD_IN) {
    displayIn = FAR_THRESHOLD_IN;
}

int barFill = map((int)displayIn, 0, FAR_THRESHOLD_IN, BAR_W - 2, 0);
- If you skip this step, the bar can draw outside its outline box
Lab: Parking Sensor
- Use the ultrasonic sensor and OLED to build a parking sensor display
- Download the starting code
- Go to https://tinyurl.com/ProjectZipGH
- Paste the following link into the top right:
https://github.com/reparke/TAC348-Making-Smart-Devices/tree/main/_exercises/week10/ultrasonic_oled_parking_sensor_start
Lab: Parking Sensor (Part 1)
- Specifications
- Read distance from the ultrasonic sensor and return the raw value
- Add a rolling average: store each reading in an array of 5 and return the average
- Improve the averaging: skip zero and out-of-range readings so the array keeps the last good values
- Observe how the display changes with each version
Lab: Parking Sensor (Part 2)
- Specifications
- Display the distance in inches on the OLED
- Display a different bitmap based on zone
- FAR (> 24 in) - green check bitmap
- STOP! (< 4 in) - red X bitmap
- NEAR (everything else) - warning bitmap
Lab: Parking Sensor (Part 3)
- Specifications
- Draw a bar graph outline at the bottom of the screen
- Calculate
barFillusingmap()so the bar grows as the hand approaches - Clamp
displayInbefore callingmap()so the bar never overflows - Fill the bar using
oled.rectFill() - Optional challenge: Add a tick mark on the bar at the STOP threshold position
Completion Checklist
- Distance readings are reasonably stable
- The distance is displayed in inches
- The bitmap changes in the FAR, NEAR, and STOP zones
- The bar grows as the object moves closer and stays inside its outline
Wiring Diagram

Sensor Wiring
| Sensor | Photon 2 |
|---|---|
| GND | GND |
| VCC | VUSB |
| TRIG | D6 |
| ECHO | D5 |
| OLED | Photon 2 |
|---|---|
| GND | GND |
| 3V3 | 3V3 |
| SDA (Blue) | SDA |
| SCL (Yellow) | SCL |
</span>